The latest It’s TIME Tampa Bay survey reveals commuters are looking for rapid transit service to get to and from work as well as expanded streetcar access.
Survey results will help the three Metropolitan Planning Organizations create the very first tri-county Long-Range Transportation Plan for Hillsborough, Pasco and Pinellas Counties. The It’s TIME Tampa Bay survey was the most successful MetroQuest survey in the United States ever, according to the survey website.Yet this "survey" is seriously flawed, clearly intended to drive an agenda rather than seek to understand the transportation and mobility needs of Hillsborough, Pinellas, and Pasco counties.
ABC further elaborates "More than 9,500 people weighed in on transportation and growth in the Tampa Bay region, leaving about 250,000 data points for consideration in the creation of its first tri-county Transportation Plan." Also highlighted were routes connection downtown Tampa, USF, and Tampa airport, extension of the Tampa Streetcar, and elevated express lanes.
It's interesting to note that the survey was completed in October 2018, and results were summarized in November 2018 by the Hillsborough MPO here (PDF). It's unclear why ABC published the news on September 27, 2019. Perhaps it was a slow news day, or perhaps there is another reason.
We'll go ahead and take the opportunity to dig into it.
How did this 2045 transportation plan survey work?
It was a classic "push poll".
A push poll is an interactive marketing technique, most commonly employed during political campaigning, in which an individual or organization attempts to manipulate or alter prospective voters' views under the guise of conducting an opinion poll. Large numbers of voters are contacted with little effort made to actually collect and analyze voters' response data.To start, the MPO Survey leads and limits choices for the respondents.
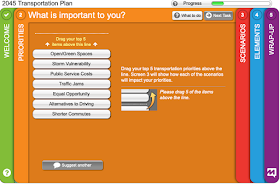 |
| "What is important to you" from the MPO Survey |
For example, we constantly hear about improved safety and "Vision Zero", an international initiative adopted by the MPOs, or alternative transportation such as bicycling or walking, from activists and transportation planners, yet those are not offered as "important to you". At least "Public Service Costs" are mentioned here... but limited (and not defined) elsewhere in the survey.
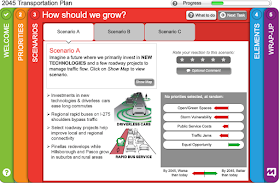
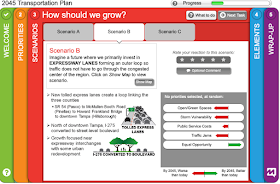
Likewise, the "Scenarios" are limited to three choices.
 |
| "How should we grow" choices from the MPO Survey |
What about expanding road capacity? After all, the roads are used daily by well over 90% of the MPOs constituents every day. To not ask the question is to answer the question.
Since this survey was released, electric scooters have been introduced in Tampa, and plans in St. Petersburg soon. It's not clear what the long term impact of micro-transit will be, but its an example where the progress of transportation technologies is quickly outpacing the expertise of the planners.
There is also a "Show Map" button that highlights some of the transportation plan for that selected scenario.
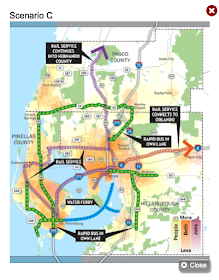 |
| "Scenario C Bus and Rail Service" from the MPO Survey |
Devoid in the survey are any real measurable metrics, such as ridership, forecasted traffic volumes, congestion reduction, commute times, fare costs, capital costs, operational expenses, just to name a few that come to mind.
What are "Public Service Costs"? Are they capital/investment costs? Operational expenses? Over how many years? Social or economic impacts? Environmental costs?
Who knows?
"Scenario C Bus and Rail" shows the "Public Service Costs" with the most green, which means "By 2045, Better than today", and Scenario A "New Technologies" and Scenario B "Expressway Lanes" with more red as "By 2045, Worse than today". This is rather disingenuous, as the subsidies and costs per mile of rail solutions are significantly more than automobiles and roads. But since the MPO has not defined "Public Service Costs", or any other factors for that matter, we can only assume common understandings of these factors to at least include operational and capital costs over the expected life of the asset.
If the MPO were to honestly do their homework, it turns out transit is the highest costs mode of transportation.
 |
| User costs range from 14 cents to 36 cents per passenger mile and subsidies range from under a penny to nearly 92 cents per passenger mile, for total costs of 15 cents to $1.20 per passenger mile. |
Even if we invest heavily in transit and ridership quadruples in the area by 2045 to around 10% (which, over 900,000 of those new residents will still be using the region's roads practically every day. That is a tremendous increase in the road use and capacity needs that cannot be overlooked, yet the survey completely ignores this issue.
Where will those million new residents by 2045 live and work? The vast majority will be where the growth is today - in unincorporated Hillsborough and Pasco counties. No where is the discussed, other than some mention of preference for "preserve neighborhoods", "more/better downtowns", and "efficient use of land", and negative for "expanded growth area" and "minimize outward growth" in the report summary. Each of these also has a cost, such as driving up the cost of housing by constraining land use, an increasing topic of discussion locally, which is not exposed anywhere. It is also not clear from the demographics of the responses that it was balanced between Tampa and the much larger unincorporated Hillsborough, which clearly will have different priorities regarding mobility (although growth management is a fast growing concern in South Hillsborough and Pasco).
This survey is so bad, that even the urban activists in the Facebook URBN TampaBay understand its poor composition.
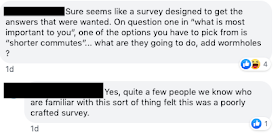 |
| Recent comments on URBN Tampa Bay |
It was also most heavily weighted with Hillsborough respondents at 61.3% of the respondents compared to Hillsborough's 48.4% of the 3 county population. Pinellas and Pasco counties were both under represented in the survey.
It's also hard to understand the city vs. county participation in the survey. There is a chart showing levels of zip code coverage in the survey, with the highest turnouts in Tampa and lesser in the other cities, and even lesser in the unincorporated parts of the counties. This may a big issue in Hillsborough, further questioning the validity of this survey, as unincorporated county has about 3.5 times the population as the city of Tampa.
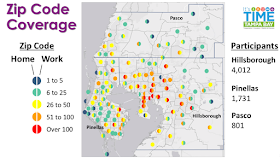 |
| Zip Code coverage from survey |
It is also interesting that the survey questions about increasing taxes, fees and tolls for roads but only taxes and fees for transit. Why do they not ask about increasing fares for transit? Do they not believe transit fares are relevant, or they cover so little of the costs of transit as to be worthless?
Clearly, everyone wold like to have what they want for free both transit and new road capacity, but we will have to pay for it some way. Increasing transit fares to cover more costs for the relatively few who chose transit should be in consideration.
At least the survey confirmed "public support is not present for I-275 boulevard conversion". I'll take that. But not letting public sentiment get in their way, and selectively ignoring their own data, the Hillsborough MPO approved further studies on the I-275 Boulevard Conversion Concept on May 8, 2019 using your tax dollars. Oh well. Their survey results from November 2018 were from such a long time ago.
If the MPO believes their survey is "not intended to be statistically valid", it begs the questions as to why do it, and what is the value? Particularly if the MPO already demonstrated they will ignore it when it suits them.
It comes down to the value of a push poll.
Asking leading or suggesting questions to push the respondent towards a particular answer.
The answer the MPO wants. When it suits them.
No comments:
Post a Comment